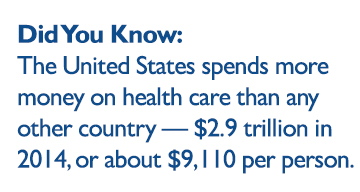
The United States spends more money on health care than any other country — $2.9 trillion in 2014, or about $9,110 per person. Spending continues to increase. With the arrival of the new Trump administration, the debate on health care costs is heightening. In preparation, let’s take a closer look at U.S. health care costs and what these numbers actually mean.
In a recent study published in JAMA in December 2016, “US Spending on Personal Health Care and Public Health,” the authors attempted to systemically quantify U.S. health care spending by breaking it down into categories, such as disease condition, age, sex and type of care. The study primarily focused on “personal health care spending,” which they defined as “the total amount spent to treat individuals with specific medical conditions,” but it also examined federal government spending on public health, including disease prevention, health protection and health promotion.
The authors first examined which medical conditions led to the most personal health care spending in 2013. Diabetes topped the list, with $101.4 billion and a spending increase of 6.1 percent between 1996 and 2013. About a third of diabetes spending was on ambulatory care, a third on inpatient care and 14 percent on pharmaceuticals. Coming in second was ischemic heart disease, with low back and neck pain third. Hypertension, falls, depressive disorders, oral disorders, sensory organ diseases, skin disease and pregnancy rounded out the top 10. Notably, cancer was not included in the top causes of spending because it was broken down into 29 individual types.
 The greatest amount of personal health care spending was for those between 50 and 74, after which total spending declined as the population size decreased. In contrast, excluding the newborn and infancy period, per-person spending increased with age. Women 85 and older had the highest spending per person, largely due to nursing facility costs.
Overall, health care spending increased approximately 3 to 4 percent per year for most age groups between 1996 and 2013, with the highest annual growth in the categories of emergency care (6.4 percent) and prescription drugs (5.6 percent). For newborns to 19-year-olds, the highest rate of growth was for attention-deficit hyperactivity disorder. For young and middle-aged adults — ages 20 to 44 — diabetes spending had the top growth rate. For older adults — ages 45 to 64 and those over 65 — annual spending for hyperlipidemia showed the highest increase.
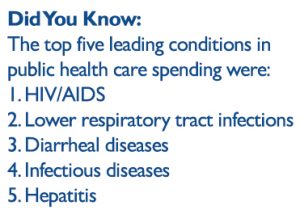
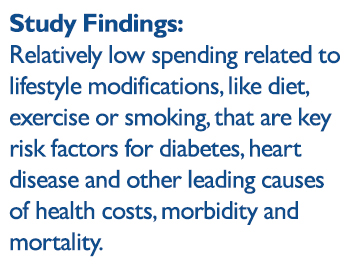
 For me, one of the most interesting take-home messages from this analysis was that the top conditions for public health spending are very different than the conditions with the highest personal health care spending. The top five leading conditions in public health care spending were all infectious diseases — HIV/AIDS first, followed by lower respiratory tract infections, diarrheal diseases, a miscellaneous category of infectious diseases and hepatitis. In contrast, relatively little public health spending is on lifestyle modifications, such as diet, exercise and smoking, that are key risk factors for diabetes, heart disease and other leading causes of U.S. personal health care costs, morbidity and mortality. Public health care spending on tobacco ranked eighth, and spending on obesity ranked 22nd.
As our nation forges on its re-evaluation of health care policies, this discrepancy should be addressed. Overall, this paper is valuable for systemically analyzing health care costs. Its findings, particularly on which conditions contribute the greatest costs in both personal and public health care, should help to guide future health care policy.
